
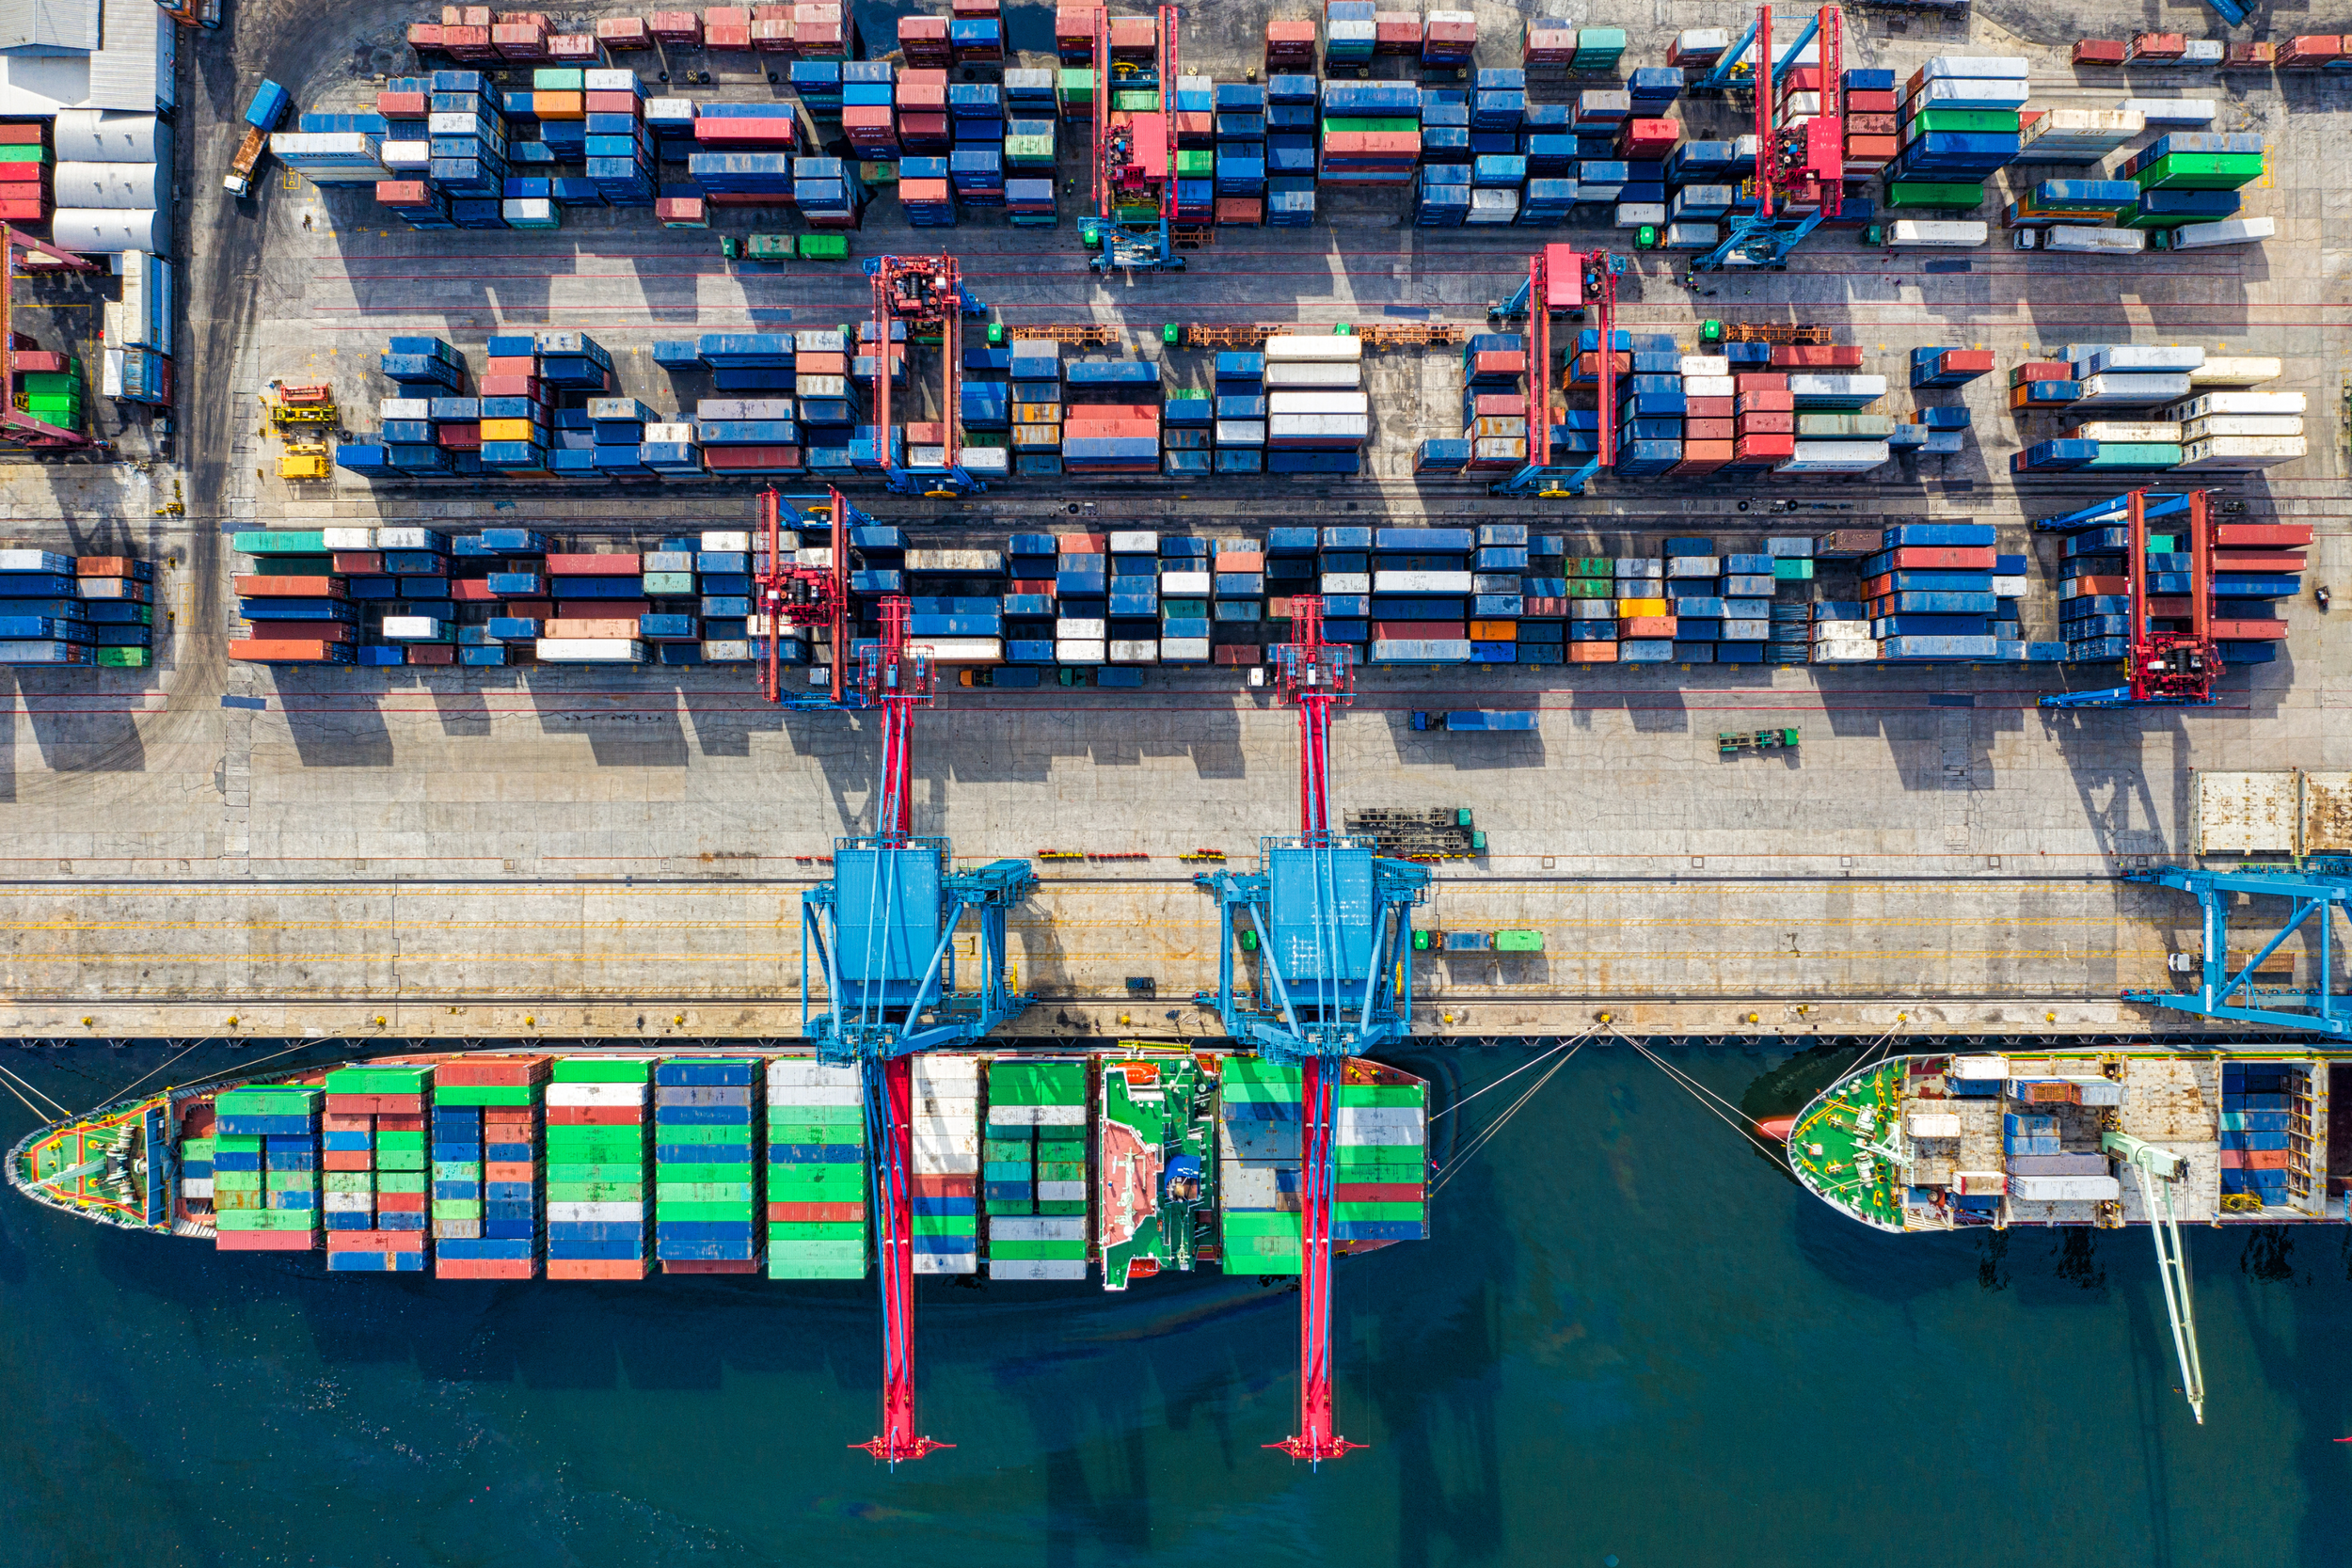
Facts & Figures
Latest Volumes

Explore how the Ports of Los Angeles and Long Beach closed out 2025 with historic achievements—record cargo volumes, operational efficiency gains, and leading environmental performance across the nation’s busiest seaport complex despite market volatility and trade uncertainty.
Analyze the latest U.S. West Coast container trade data showing how the Ports of Los Angeles and Long Beach, while still consolidating Pacific trade, saw shifts in their share of national containerized import and export tonnage through October 2025 amid broader coastal market dynamics and China trade turbulence.
Unpack the latest maritime data in “Thank Heavens for Scrap Paper,” exploring collapsing electric vehicle export volumes, shifts in containerized freight patterns, and how scrap paper tonnage trends are reshaping port traffic and supply chain dynamics in early 2026.
Explore how containerized trade between the U.S. and China has steadily declined over the past decade—dropping China’s share of inbound and outbound tonnage at major U.S. West Coast ports—and what this shift reveals about tariffs, supply chains, and evolving global trade patterns.
Get the latest data on December 2025 container traffic across North American seaports, including TEU volumes at major gateways like Los Angeles, Long Beach, Oakland, Vancouver, and Prince Rupert, year-over-year trends, and insights into annual totals and regional performance.
Dive into comprehensive November 2025 container traffic statistics across North America’s major ports—including the Ports of Los Angeles, Long Beach, Oakland, New York/New Jersey and others—with year-over-year TEU trends, regional volume shifts, and broader trade patterns shaping the end of the year.

Explore the actual November TEU tallies reported by major North American ports, revealing variations in container volume performance, year-over-year comparisons, and how key gateways are navigating evolving trade conditions in late 2025.
Learn how California’s inland waterways—critical channels connecting the Sacramento and Stockton deep-water ports to the Pacific—face infrastructure challenges like severe shoaling, aging bridges, and insufficient dredging funding that threaten navigation, ag-export flows and foreign trade worth millions annually.
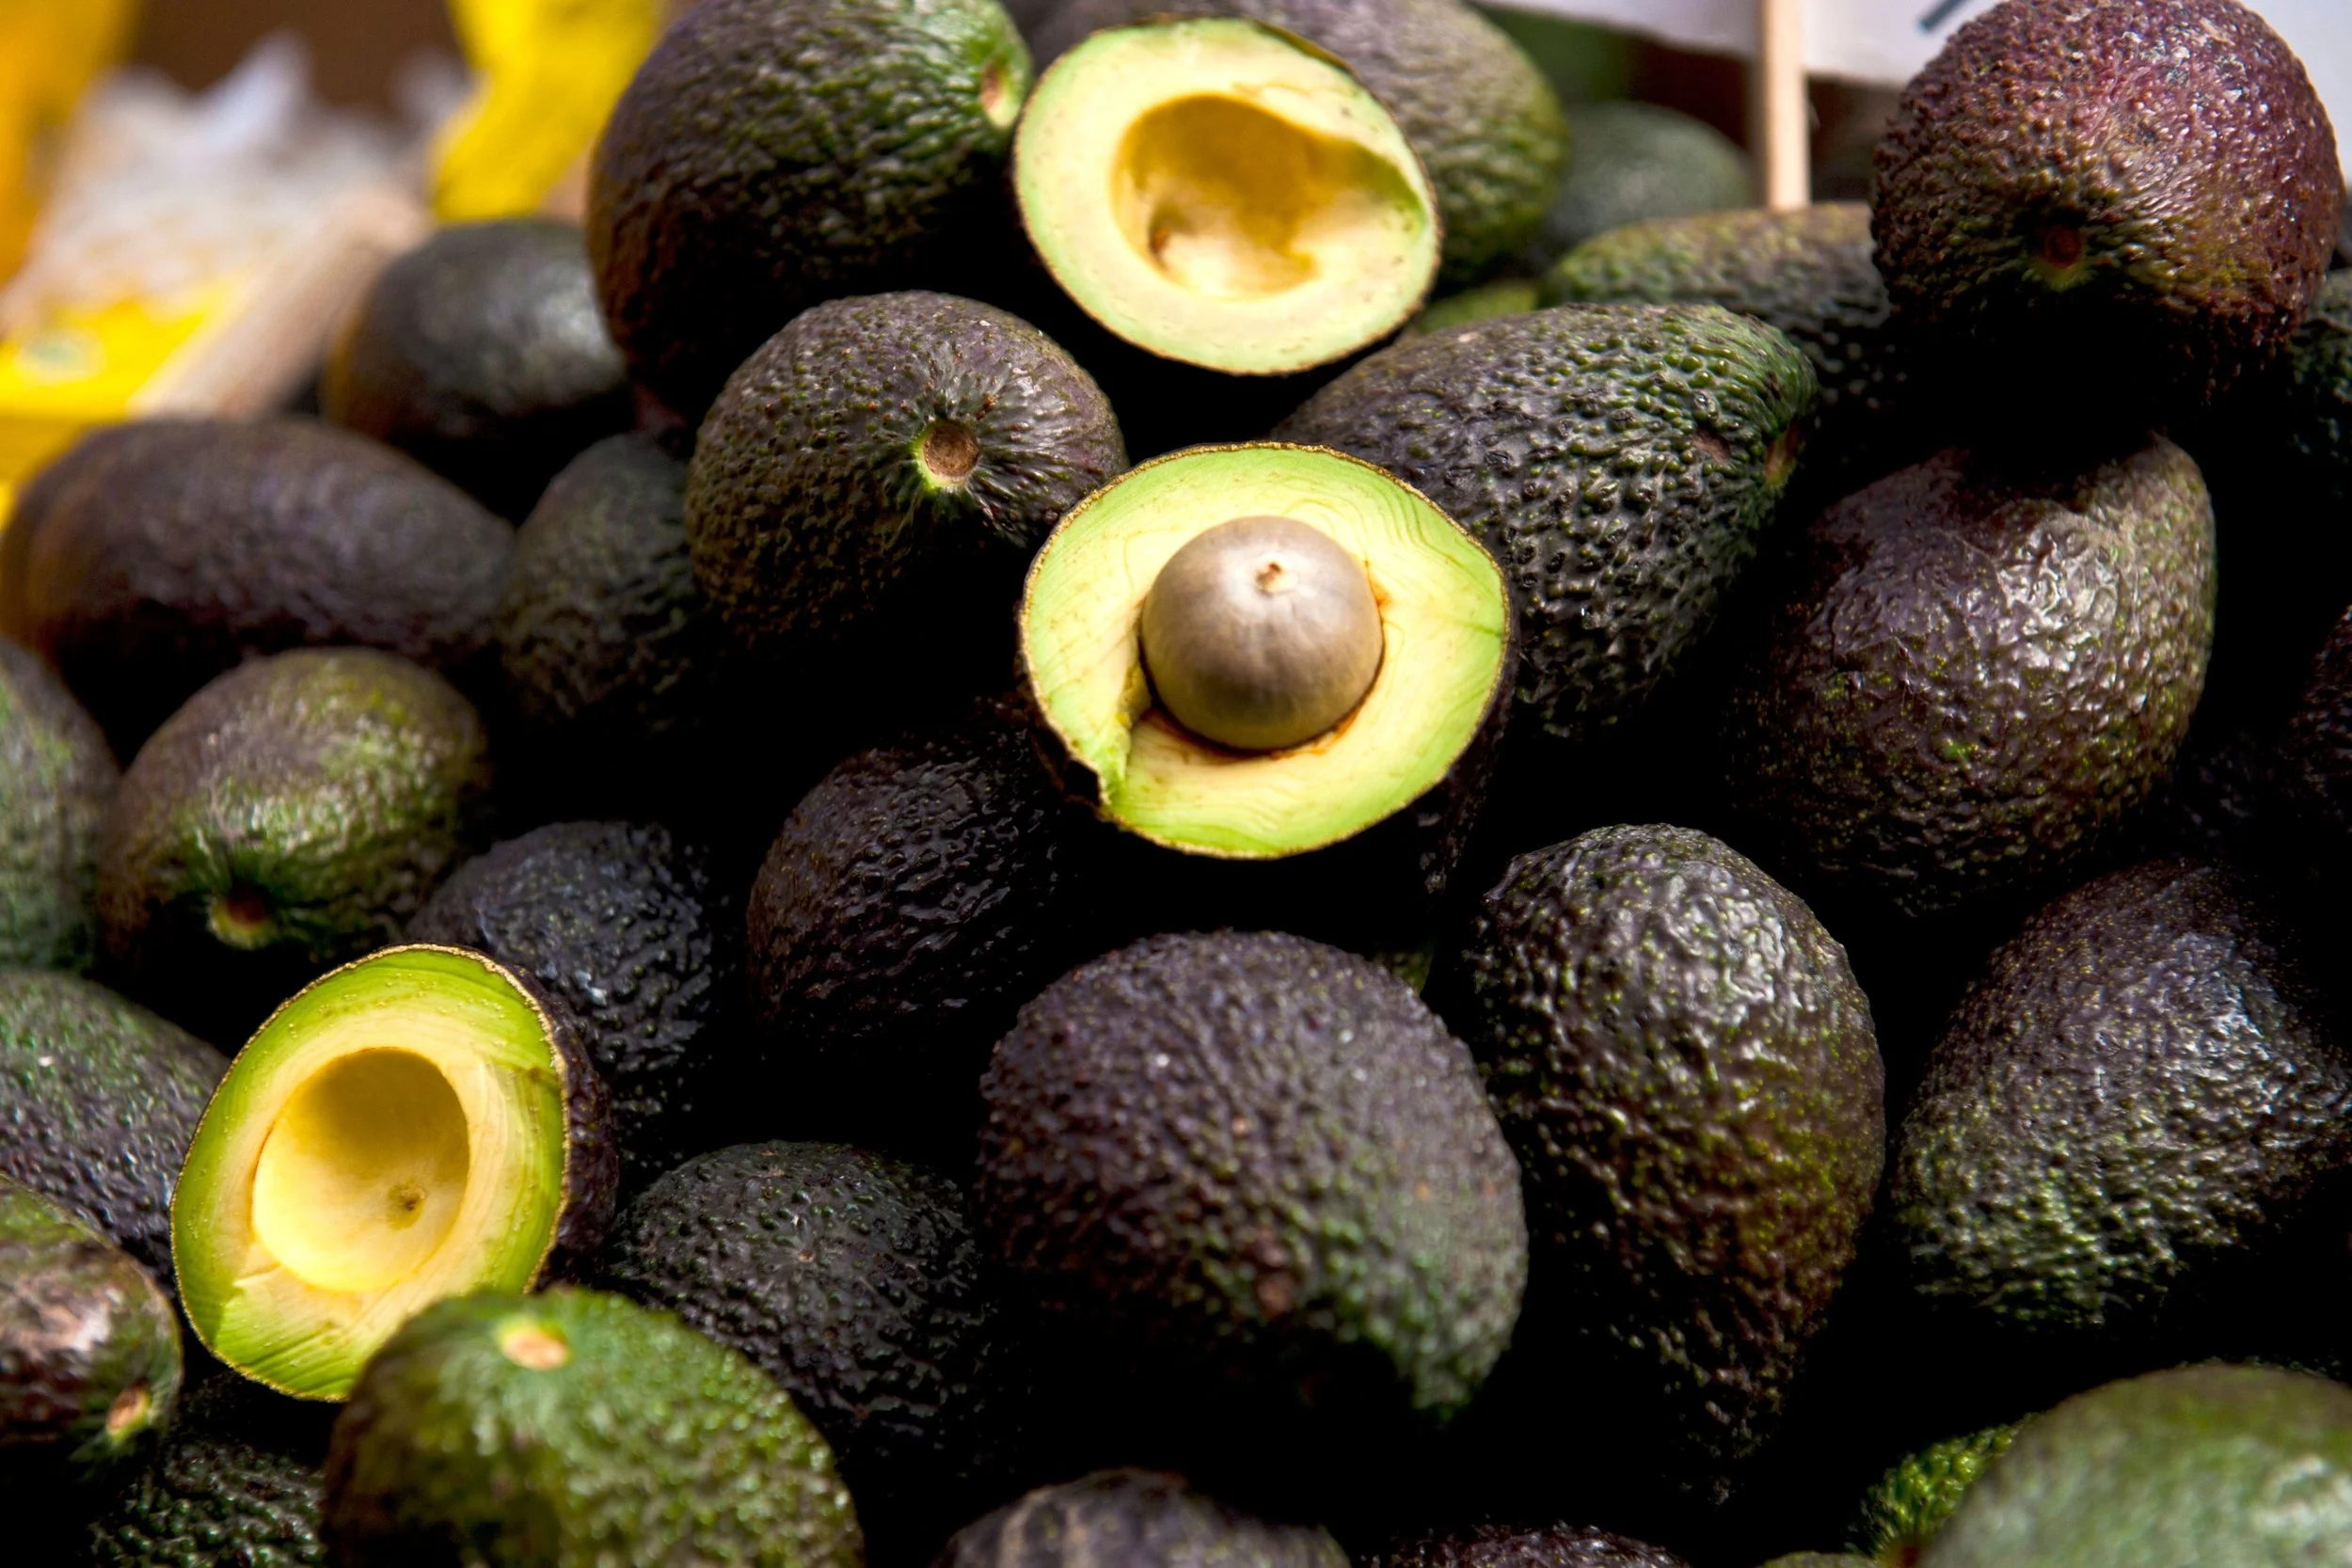
Discover 2025 trade highlights for avocados, tree nuts (almonds, walnuts, pistachios), and bulk wine — including Mexico’s dominant role in U.S. avocado imports, export trends amid China trade disruptions, and resilient maritime wine shipment volumes through key gateways like the Port of Oakland.


In September 2025, the Ports of Los Angeles and Long Beach saw declines in container volumes year-over-year, but still posted gains compared to 2019. Other major U.S. and Canadian seaports showed divergent trends. Explore full port comparisons and regional performance in this latest analysis.

In a new executive order, the U.S. imposed higher tariffs on imported kitchen cabinets and bathroom vanities, aiming to protect domestic industries. But these levies could also reduce container traffic through major gateways like the Ports of Los Angeles and Long Beach. Explore trade shifts, sourcing changes, and port impacts in this analysis by Natasha Villa.

With China halting U.S. soybean imports, shipments to alternate buyers like Egypt, Germany, Indonesia, and Japan are rising—but not enough to fully compensate. Explore export trends, port flows, and market impacts in this deep dive

California’s almond, walnut, and pistachio exporters are redirecting more cargo through Southern California ports and Houston, reducing Oakland’s historic share. Learn why logistics, rail links, and market dynamics are driving this shift in U.S. agricultural export flows.

In August 2025, the Ports of Los Angeles and Long Beach handled nearly 945,000 inbound loaded TEUs—down 2.2% year-over-year but up 24.3% vs. 2019. Get a full breakdown of U.S. port volumes, inbound/outbound trends, and YTD comparisons in our latest data release.

In August 2025, San Pedro Bay ports handled 944,832 inbound loaded TEUs, a 2.2% decrease from the previous year but a 24.3% increase from 2019.

In July 2025, U.S. West Coast ports accounted for 37.2% of U.S. containerized import tonnage, with the Ports of Los Angeles and Long Beach capturing 28.8% of the share. This marks a slight year-over-year decline from 37.8% in July 2024. Notably, the LA/LB ports increased their share of containerized import tonnage from East Asia by 1.3 percentage points, reflecting their continued dominance in trans-Pacific trade.


Get insights into container dwell times at the San Pedro Bay port complex in December 2025, highlighting average truck and rail cargo movement, year-over-year improvements, and ongoing operational efficiency across the Ports of Los Angeles and Long Beach.
Container dwell times at the San Pedro Bay Port Complex remained consistent through November 2025, reflecting ongoing operational stability as the holiday season reached its peak. Both truck- and rail-destined cargo continued to move efficiently, supported by sustained coordination among marine terminal operators, drayage partners, and rail providers.

In September 2025, San Pedro Bay ports maintained efficient operations with truck dwell times averaging 2.75 days and rail dwell times at 3.98 days.

Track August 2025 container dwell times at the Ports of Los Angeles and Long Beach. Local truck dwell averaged 2.73 days and rail dwell improved to 4.98 days, reflecting efficient cargo flow and strong supply chain coordination at the nation’s busiest port complex.

July 2025 dwell times at the Ports of Los Angeles & Long Beach stay efficient — truck dwell ~ 2.87 days, rail ~ 5.18 days — despite record-breaking cargo volumes.

Explore June 2025 dwell time data for the San Pedro Bay ports. Learn how improved rail and truck cargo movement at the Ports of LA and Long Beach reflects continued operational efficiency.

May 2025 dwell times at the Ports of Los Angeles and Long Beach held steady, with rail cargo averaging 4.70 days and truck cargo just under 3. Learn how consistent terminal operations are supporting resilient supply chains amid global trade uncertainty.

Dwell times at the San Pedro Bay Ports improved in April 2025, with rail-destined cargo averaging 4.72 days - the lowest since April 2024. Truck-bound containers remained stable at 2.78 days for the twelfth consecutive month. This consistency reflects continued coordination and efficiency across the supply chain, even amid shifting trade volumes.

March 2025 dwell time data shows improved rail container movement at the Ports of Los Angeles and Long Beach, with rail dwell times dropping to 6.75 days and truck times remaining steady, according to PMSA.


Dwell Times
Reports & Studies

By Tim Jemal, CEO, Supply Chain Federation
A Ramboll study commissioned by the Supply Chain Federation finds California’s Warehouse ISR adds high costs with no emission gains—threatening jobs & supply chains.
By Gene Seroka & Mario Cordero, Port of Los Angeles, Port of Long Beach
Ports of LA & Long Beach propose ‘CAAP Plus’—a cooperative, enforceable plan to cut port emissions faster than SCAQMD’s PR 2304 rulemaking approach.

John Wolfe, CEO for the Northwest Seaport Alliance
Recently the Ports of Seattle and Tacoma and the Northwest Seaport Alliance released a first of its kind collaborative effort to measure the statewide economic impact of our Puget Sound ports. From the airport, to our marine cargo gateway, from the fishing fleets to the ecosystem of industrial lands that support all our port’s activities, these ports have a regional to global impact.